Engineering
What technology skills result in the highest compensation for developers?
Analysis of 2024 Stack Overflow Developer Survey data.
What tech skills do developers need to get paid more?
I have a particular interest in professional skill development. Soft skills are timeless and an area that should always be worked on. What's less timeless are technology skills. With the technology landscape rapidly evolving, developers must continuously review and update their technology skill set to stay competitive.
Method
To identify which skills are worth focusing on, I undertook an analysis of the 2024 Stack Overflow Developer Survey dataset . The anonymous survey of over 6500 developers collected data on the respondents' education, total compensation, years of experience, and use of programming languages and frameworks.
A correlation analysis was conducted (link to analysis) to explore the relationship between these factors and total compensation. P-values below 0.05 were considered statistically significant. Although strong correlations are hard to find, many weaker correlations where discovered. Economic outcomes are influenced by numerous factors, so weaker correlations still offer valuable insight.
For this analysis, the dataset has been filtered to only include full-time professional developers who provided their total compensation information. Developer compensation varies due to local economic conditions, so even if total compensation were normalised to a single currency, comparisons between respondents in different countries would not yield valid results. Instead, each correlation will be evaluated independently for each country.
After filtering, the countries with the most respondents were the USA, Germany and the UK. For interest's sake, I also included Australia, even though limited data points were available. With these four countries selected, let's look at the correlations.
| Country | Filtered Response Count |
|---|---|
| United States of America | 4667 |
| Germany | 1758 |
| United Kingdom of Great Britain and Northern Ireland | 1333 |
| Ukraine | 1179 |
| India | 1150 |
| Canada | 853 |
| France | 790 |
| Brazil | 632 |
| Poland | 540 |
| Netherlands | 536 |
| Spain | 513 |
| Italy | 498 |
| Sweden | 474 |
| Australia | 459 |
Statistical Significance of Factors
Of the 213 factors investigated, only a small subset where statistically significant. The below diagram shows these factors sorted in order of strength of correlation (r). P-values, shown in red are also displayed, and it can be seen that the majority of factors has P-values below 0.05 (red dashed line).
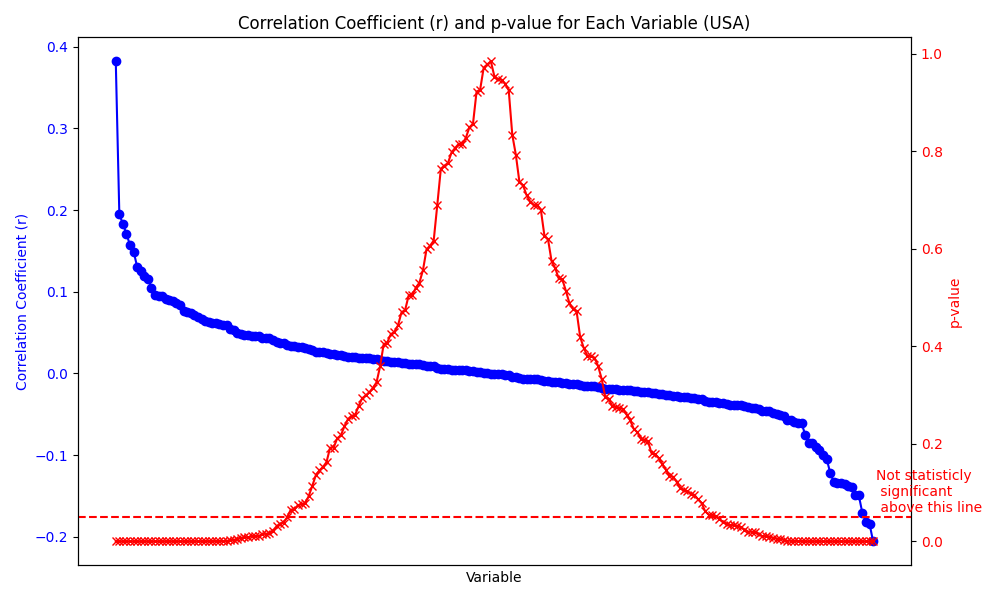
Its also important to note that many factors were only statistically significant in a particular region. The smaller datasets, especially Australia, had fewer statistically significant correlations than the US.
This analysis used self-reported data which introduces the possibility of inaccuracies or exaggerations. The correlation analysis did not control for other factors, even those within the same dataset. Correlations do not necessarily infer causation.
Results
Below are the factors that had a statistically significant positive correlation with total compensation in all four countries. The table is sorted by the average r-value of all four countries.
Factors strongly associated with higher compensation in all analysed countries
| GER_r | UK_r | USA_r | AU_r | AVG_r | |
|---|---|---|---|---|---|
| WorkExp | 0.514256 | 0.412203 | 0.382118 | 0.430147 | 0.434681 |
| ToolsTechHaveWorkedWith_Terraform | 0.198164 | 0.167319 | 0.183067 | 0.124752 | 0.168326 |
| ToolsTechHaveWorkedWith_Kubernetes | 0.157696 | 0.219061 | 0.157023 | 0.119103 | 0.163221 |
| MiscTechHaveWorkedWith_Apache Kafka | 0.125133 | 0.163341 | 0.149304 | 0.197993 | 0.158943 |
| ToolsTechHaveWorkedWith_Homebrew | 0.095859 | 0.122910 | 0.170613 | 0.184254 | 0.143409 |
| ToolsTechHaveWorkedWith_Docker | 0.073619 | 0.151586 | 0.118815 | 0.146483 | 0.122626 |
| LanguageHaveWorkedWith_Go | 0.070691 | 0.100121 | 0.125164 | 0.140733 | 0.109177 |
As expected, years of work experience strongly correlates with compensation in all four countries. Next, we can see some of my favorite tools such as Terraform, Kubernetes, Homebrew and Docker. In my mind, this suggests there is value in developing DevOps and Cloud skill sets.
There were, however, further factors that were strongly associated with higher compensation in specific regions. These have been tabulated below.
Factors strongly associated with higher compensation in USA
| USA_r | |
|---|---|
| PlatformHaveWorkedWith_Amazon Web Services (AWS) | 0.194690 |
| EdLevel_master | 0.130262 |
| LanguageHaveWorkedWith_Ruby | 0.116040 |
| ToolsTechHaveWorkedWith_Make | 0.105124 |
Factors strongly associated with higher compensation in UK
| UK_r | |
|---|---|
| PlatformHaveWorkedWith_Amazon Web Services (AWS) | 0.186091 |
| EdLevel_bachelor | 0.158804 |
| PlatformHaveWorkedWith_Google Cloud | 0.155989 |
| EdLevel_associate | 0.148694 |
| EdLevel_master | 0.133310 |
| ToolsTechHaveWorkedWith_Make | 0.133135 |
| LanguageHaveWorkedWith_Groovy | 0.128558 |
| EmbeddedHaveWorkedWith_Catch2 | 0.127435 |
| EmbeddedHaveWorkedWith_Boost.Test | 0.124523 |
| ToolsTechHaveWorkedWith_Pulumi | 0.105890 |
Factors strongly associated with higher compensation in Germany
| GER_r | |
|---|---|
| PlatformHaveWorkedWith_Amazon Web Services (AWS) | 0.201221 |
| EdLevel_bachelor | 0.283945 |
| EdLevel_associate | 0.285089 |
| EdLevel_master | 0.315944 |
| EdLevel_partialuni | 0.250223 |
| LanguageHaveWorkedWith_Scala | 0.109548 |
| ToolsTechHaveWorkedWith_Google Test | 0.111460 |
| EmbeddedHaveWorkedWith_LLVM's Clang | 0.114205 |
| EdLevel_professional | 0.141278 |
| EdLevel_secondary | 0.100089 |
Factors strongly associated with higher compensation in Australia
Note that the Australian dataset was quite small and may be under-powered. So, the correlations in the table below should be taken with a grain of salt, particularly given there were no statistically significant correlations between these factors and compensation in any other country analysed.
| AU_r | |
|---|---|
| ToolsTechHaveWorkedWith_Yarn | 0.120971 |
| LanguageHaveWorkedWith_Solidity | 0.111174 |
| LanguageHaveWorkedWith_Objective-C | 0.127747 |
Conclusion
When looking at the factors that are strongly correlated with higher pay in each country, we can see that AWS skills are a winner. DevOps and Cloud skills consistently correlate with higher compensation.
Education level was strongly correlated with higher compensation in the UK and Germany, particularly the masters level education. However, in my experience, many developers undertake a masters degree after several years of professional experience. So, we could be seeing years of experience causing increase in compensation, with the masters degree being dragged along for the ride. Or, maybe a masters degree is independently strongly correlated; further analysis is needed.
It seems that to earn the big bucks, focus on;
- gaining years of experience,
- use modern cloud tools such as AWS, Kubernetes and Containers,
- use Homebrew on a Mac,
- learn Golang,
- work with Apache Kafka.
In this note
- Method
- Statistical Significance of Factors
- Results
- Factors strongly associated with higher compensation in all analysed countries
- Factors strongly associated with higher compensation in USA
- Factors strongly associated with higher compensation in UK
- Factors strongly associated with higher compensation in Germany
- Factors strongly associated with higher compensation in Australia
- Conclusion